
スローな TII にしてくれ
公開日:
:
最終更新日:2015/02/24
マネー
TII をさらに使いやすくする方法を考えました。
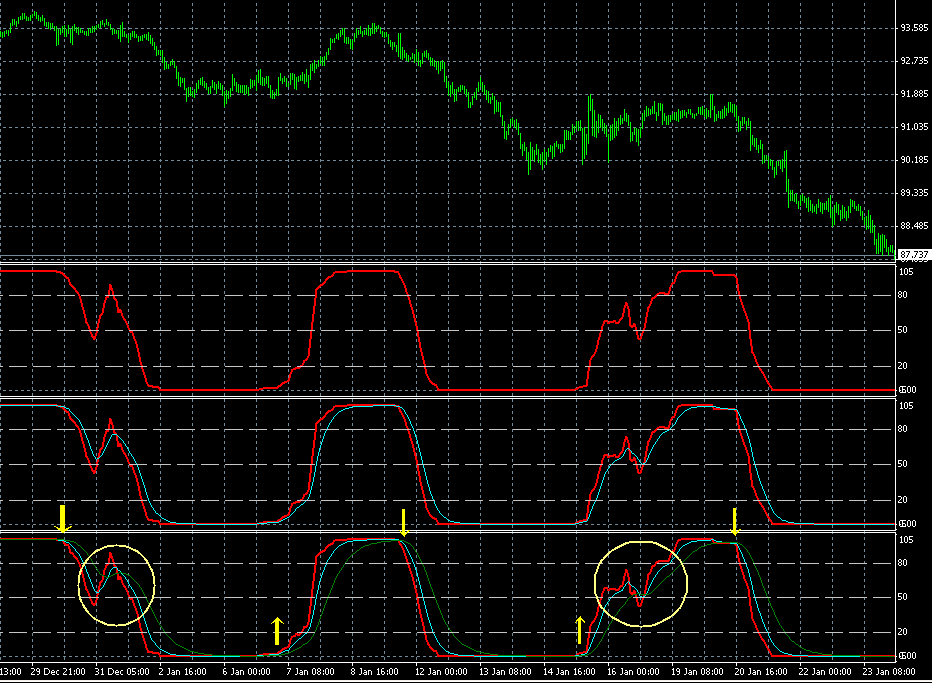
下のチャートのサブウィンドウに3種類の TII すなわち、
- オリジナルの TII
- TII にシグナルを付加したもの(自作)
- TII のシグナルをさらに平滑化したシグナルのシグナルを付加したもの(自作)
を表示してみました。
スローストキャステクスっぽくなってしまいましたネ。
*
この手の指標は 0からの上離れと 100からの下離れを売買指標にするわけ(一番下のサブウィンドウでの↑↓の部位)ですが、それはこの3種類のどれでも簡単に判定できます。
問題は 50付近での絡み合いの部分です(○で囲った部分)。
ここで S字カーブを描いたり、場合によっては元来た方へ戻る場合があり、それぞれの処理が必要となります。
S字カーブを描いたりする場合、右の○のように TII が連峰状(六ヶ岳?)になるとシグナルがない場合はドテン売買がその都度発生し、ロスがふくらみます。
シグナルとのクロスで 2回までに減らせますし、シグナルと「シグナルのシグナル」とのクロスではパラメーター次第ですがさらに回数を減らせます。
*
裁量の方にはたいした違いはないのですが、EA化するのには重要な処置になります。
関連記事
- Trend Intensity Index という指標
- Trend Intensity Index という指標(2) シグナルを付加
- Trend Intensity Index を使った EA
- Trend Intensity Index を使った EA(2) Damiani filter版
*
プログラムソース(オリジナルの TII_RLH を改変)
//+--------------------------------------------------------------------+
//|                                                   TII_RLH_S2       |
//|                                    Copyright ゥ 2006, Robert Hill   |
//|                                       http://www.metaquotes.net/   |
//+--------------------------------------------------------------------+                                                                   |

#property  copyright "Copyright 2006, Robert Hill "
#property  link      "http://www.metaquotes.net/"
//---- indicator settings
#property  indicator_separate_window
#property  indicator_buffers 3
#property  indicator_color1  Red
#property  indicator_color2  Aqua
#property  indicator_color3  Green

#property  indicator_width1  2
#property  indicator_width2  1
#property  indicator_width3  1

//----
extern int Major_Period=60;
extern int Major_MaMode=1; //0=sma, 1=ema, 2=smma, 3=lwma, 4=lsma
extern int Major_PriceMode=0;//0=close, 1=open, 2=high, 3=low, 4=median(high+low)/2, 5=typical(high+low+close)/3, 6=weighted(high+low+close+close)/4
extern int Minor_Period=30;
extern color LevelColor=Silver;
extern int BuyLevel=20;
extern int MidLevel=50;
extern int SellLevel=80;

extern int SigPeriod1 = 8;
extern int SigPeriod2 = 10;

//---- buffers
double ma[];
double ma_dev[];
double tii[];

double tiis[];
double tiis2[];

//+------------------------------------------------------------------+
//| Custom indicator initialization function                         |
//+------------------------------------------------------------------+
int init()
  {
//---- drawing settings
   IndicatorBuffers(5);
   SetIndexStyle(0,DRAW_LINE);
   SetIndexDrawBegin(0,Major_Period);
   IndicatorDigits(MarketInfo(Symbol(),MODE_DIGITS)+2);
//---- 3 indicator buffers mapping
   SetIndexBuffer(0,tii);
   SetIndexBuffer(1,tiis);
   SetIndexStyle(1,DRAW_LINE);
   SetIndexDrawBegin(1,Major_Period);

   SetIndexBuffer(2,tiis2);
   SetIndexStyle(2,DRAW_LINE);
   SetIndexDrawBegin(2,Major_Period);

   SetIndexBuffer(3,ma_dev);
   SetIndexBuffer(4,ma);

//---- name for DataWindow and indicator subwindow label
   IndicatorShortName(" TII  ,  Major_Period ( "+Major_Period+" )  ,  Minor_Period  ( "+Minor_Period+" ), ");
   SetLevelStyle(STYLE_DASH,1,LevelColor);
   SetLevelValue(0,BuyLevel);
   SetLevelValue(1,MidLevel);
   SetLevelValue(2,SellLevel);
//---- initialization done
   return(0);
  }
//+------------------------------------------------------------------+
//| LSMA with PriceMode                                              |
//| PrMode  0=close, 1=open, 2=high, 3=low, 4=median(high+low)/2,    |
//| 5=typical(high+low+close)/3, 6=weighted(high+low+close+close)/4  |
//+------------------------------------------------------------------+
double LSMA(int Rperiod,int prMode,int shift)
  {
   int i;
   double sum,pr;
   int length;
   double lengthvar;
   double tmp;
   double wt;
//----
   length=Rperiod;
   sum=0;
   for(i=length; i>=1;i--)
     {
      lengthvar=length+1;
      lengthvar/=3;
      tmp=0;
      switch(prMode)
        {
         case 0: pr=Close[length-i+shift];break;
         case 1: pr=Open[length-i+shift];break;
         case 2: pr=High[length-i+shift];break;
         case 3: pr=Low[length-i+shift];break;
         case 4: pr=(High[length-i+shift] + Low[length-i+shift])/2;break;
         case 5: pr=(High[length-i+shift] + Low[length-i+shift] + Close[length-i+shift])/3;break;
         case 6: pr=(High[length-i+shift] + Low[length-i+shift] + Close[length-i+shift] + Close[length-i+shift])/4;break;
        }
      tmp =(i - lengthvar)*pr;
      sum+=tmp;
     }
   wt=sum*6/(length*(length+1));
//----
   return(wt);
  }
//+------------------------------------------------------------------+
//|                                                                  |
//+------------------------------------------------------------------+
int start()
  {
   int i,j,limit;
   double sdPos,sdNeg;

   int counted_bars=IndicatorCounted();
   if(counted_bars<0) return(-1);
   if(counted_bars>0) counted_bars--;
   limit=Bars-counted_bars;
   if(counted_bars==0) limit-=1+MathMax(Major_Period,Minor_Period);

//----
   for(i=limit; i>=0; i--)
     {
      if(Major_MaMode==4)
        {
         ma[i]=LSMA(Major_Period,Major_PriceMode,i);
        }
      else
        {
         ma[i]=iMA(NULL,0,Major_Period,0,Major_MaMode,Major_PriceMode,i);
        }
      ma_dev[i]=Close[i]-ma[i];
     }
//========== COLOR CODING ===========================================
   for(i=0; i<=limit; i++)
     {
      sdPos=0;
      sdNeg=0;

      for(j=i;j<i+Minor_Period;j++)
        {
         if(ma_dev[j]>=0) sdPos=sdPos+ma_dev[j];
         if(ma_dev[j]<0) sdNeg=sdNeg+ma_dev[j];
        }
      tii[i]=100*sdPos/(sdPos-sdNeg);
     }
   for(i=0; i<=limit; i++)
     {
      tiis[i] = iMAOnArray(tii,0,SigPeriod1,0,MODE_EMA,i);
     }
   for(i=0; i<=limit; i++)
     {
      tiis2[i] = iMAOnArray(tiis,0,SigPeriod2,0,MODE_EMA,i);
     }

//----
   return(0);
  }

//+------------------------------------------------------------------+
###
関連記事
-

-
ユダヤ人大富豪の教え / 本田健
ユダヤ人大富豪の教え 本田 健 大和書房 2003-06-19 売り上げラ
-

-
[FX] 無限回廊act1 バグなしバージョン
以前、MT4用のFX自動売買ソフト「無限回廊」システムact1 のバグありお試しバージョンを公開して
-
-
高配当株投資の実利回りについて
そろそろ 楽天SCHD が発売されるかとやきもきしているところです。 楽天SCHD は、アメリカの
-
-
【FX】2本のWMAでエントリする EA(Vulkan Profit風)
Vulkan Profit というそこそこ有名なインジケーターがあります。 内部のロジックは 2本
-
-
生命保険の支払いの荷が降ろせそうな年頃
この前来た●●生命保険からの通知で、3つのうち2つが「保険料払込み済み」になっているのに気づきました
-
-
【FX】エターナルエンジンという EA(2)
以前に紹介した MQL5 フォーラムで 599$で販売されている Eternal Engine とい
-
-
【FX】London Box というプログラム
昨日作った Tokyo Box は東京時間でできたボックスの高値、低値をロンドン時間でブレイクするの
-
-
【FX】Axiory 新ナノ口座(3つめ)発進
以前の記事「Axiory でハロウィーンキャンペーンやっています」で新設して、10万円を入金して 1
-
-
【FX】アンディさんのリアルタイム雲 (3)
最強の「FX理論」を君たちに教えたい posted with amazlet